Data-Based Deployment of SSPs: A Growing Trend
By David Todd
“We found ourselves in a budget crunch, and had to make hard decisions about the extent of our safety service patrols.” So said Jim Hogan, Executive Director of Statewide Traffic Operations for the New Jersey DOT when reviewing the determining factors of choosing patrol routes for NJDOT’s Safety Service Patrol. “Capital needs required that we give up some of our operational budget. The SSP had to contribute. This forced us to use an objective criteria to maximize the dollars we do have.”
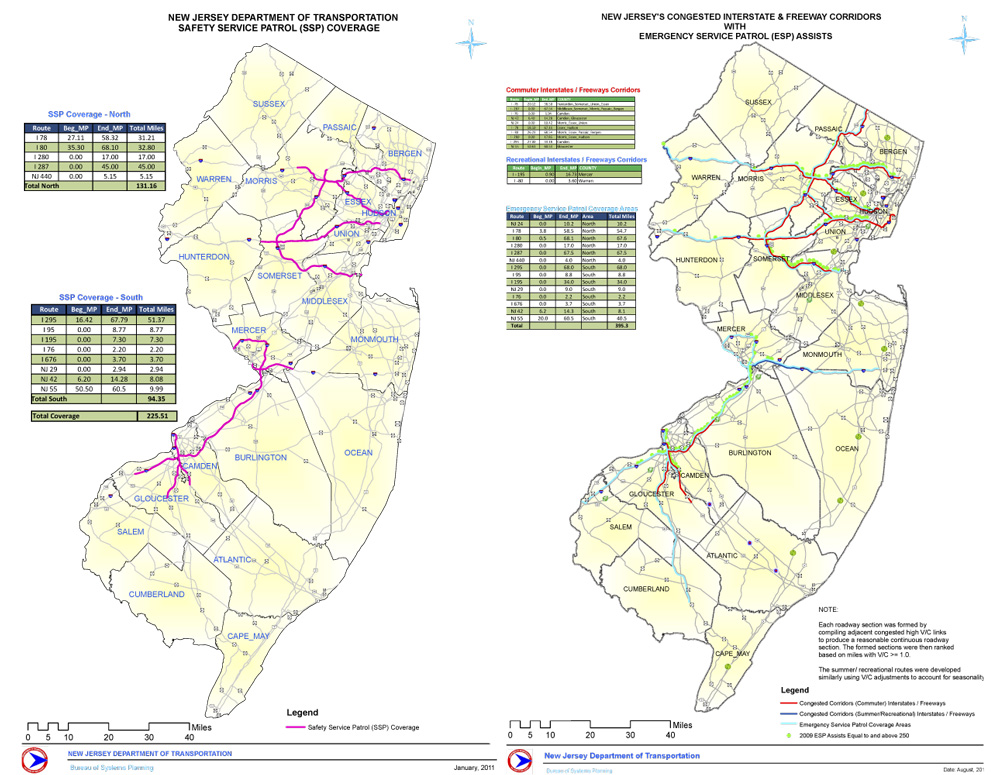
When the NJDOT began the patrols in 1994 the criteria they used to determine patrol routes was primarily congestion by mile. The original 60 miles patrolled were the most congested in the state. As service expanded over the years, from 60 to 395 miles, the basis for what roads were added was intuitive reasoning.

New Jersey DOT recently reduced patrol route coverage, but expanded patrol hours to provide better service to New Jersey motorists. Click on the image for a downloadable version of the patrol maps.
Congested areas and accident areas were obvious, whether data was available or not. But now, faced with cutting service, NJDOT decided to use an objective criteria. “We weighed three factors,” says Hogan. “The DOT’s Congestion Management System told us which roads were the most congested, based on hard data. On top of this we overlaid those roads with 50 to 100 accidents per mile per year, and those roads where service patrols made 250 or more assists per mile per year.” Based on that, the NJDOT reduced the mileage to 225 miles that were maximized in all three criteria. This changed service begins in 2011.
While cutting routes was difficult for the NJDOT, doing it via objective criteria had some benefit. “We were able to expand hours in some areas,” says Hogan, “and to provide service on weekends in many locations. The New Jersey driver will benefit as a result of the approach we are taking.”
Establishing Safety Service Patrol routes and service times based on hard data and objective criteria will become more prevalent as traffic managers seek to provide the best service with limited and shrinking resources. In 2007 the Journal of Intelligent Transportation Systems published a paper based on the Virginia DOT’s experience explaining how to make these decisions using annual average daily traffic to prepare an assist prediction model. This model was matched to incident data between interchanges on major roads and desired level of service to develop an SSP deployment tool.

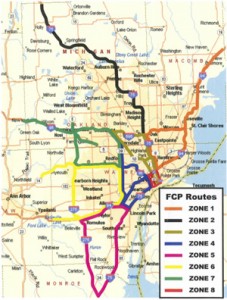
Michigan DOT's Freeway Courtesy Patrol currently covers the areas mapped above, but following a hired cosultant's review of patrol routes the Michigan DOT anticipates implementing a number of the recommendations to the patrol routes when the service contract comes up for renewal in 2011.
For the Michigan DOT, budget was not a factor in their recent study to evaluate their Freeway Courtesy Patrol (FCP) routes. “We wanted to expand service,” says Sandra Montes, P.E., Operations Engineer for the Michigan Intelligent Transportation Systems Center (MITS). “We sensed that some of our routes weren’t right, but didn’t have the data needed to make changes.” A consultant was hired to assemble data on accidents (based on MITS data) and FCP stops (based on data from the FCP contractor), and the consultant issued a report. “The recommendations in the consultant’s report confirmed what we sensed. We anticipate implementing a number of the recommendations when the service contract comes up for renewal in 2011.”
While budgetary pressures can play a deciding factor in the ability to cover more or less patrol routes, methods used by NJDOT and VADOT that identify the most congested and incident prone routes allow SSPs to continue to provide service where it is needed most. As the Michigan DOT has shown, better service can be the driving reason to apply rigorous criteria for SSP routes. Perhaps a trend is in place, to use performance-based criteria to replace intuitive reasoning to match need with coverage.
